


Research within the Geodynamics Group is directed at processes that deform the Earth's crust and lithosphere as well as the Earth as a whole over a broad range of time and length scales. The broad objective is to seek an understanding of the physical processes acting on and within the planet through numerical modelling and analysis of geological, geophysical and geodetic data.
New developments in the data collection and analysis have included: (i) the determination of accurate constraints on the timing and duration of the Last Interglacial (Ve) stage through the dating of corals from the Western Australian margin using techniques in thermal ionization mass spectrometry (TIMS) (jointly with the Geochronology and Isotope Geochemistry Group), (ii) the determination of new constraints on the limits of the Antarctic ice sheet from new crustal rebound observations from the Antarctic margin, (iii) K-Ar and Ar-Ar ages across the Southern Alps of New Zealand to constrain models of thermal evolution and uplift, and (iv) the imaging of the deep crustal structure across the Musgrave Block of South Australia using new teleseismic travel time data. New developments in the area of numerical methods include (i) the modelling of erosion and sedimentation and their feedback, in the dynamical evolution of orogenic belts and compressional plate boundaries, (ii) improved global and regional modelling of the response of the Earth to surface loads, particularly in the context of changing ice loads and the concomitant changes in water loads, and (iii) the ongoing developments, with the Seismology Group, of new computational techniques for the parameterisation of earth models and for solving partial differential equations relevant to deformation of the crust-lithosphere-mantle system.
Late in 1994 the Group received new funding for its Neotectonics research which is directed at an integrated geophysical, geodetic and geological study of recent tectonic processes (see the 1994 report for more information). The first appointees to the new positions arrived this year: Dr P. Johnston to work, interalia, on aspects of mantle rheology and sea-level change; Dr P. van der Beek to work on aspects of the integration of the numerical modelling with geological and geophysical data; and Dr P. Tregoning to work on applications of GPS to crustal deformation monitoring. Two new PhD students (Mr K. Flemming and Mr Y. Yokoyama) joined the four longer-serving students to work on different geological and geophysical aspects of sea-level change. Ms T. Semeniuk joined the group during the summer of 1994-1995 as a Vacation Scholar. Visitors to the group have included Drs C. Beaumont and P. Fullsack from Dalhousie University and Dr G. Bassi (formerly from the Vrije Universiteit, Amsterdam) to work on aspects of the modelling of tectonic processes, and Dr P. Wu to work on aspects of glacial rebound.
High-precision U-series dating of corals from Western Australia and implications for the timing and duration of the Last Interglacial
C. Stirling, T. Esat, K. Lambeck and M. McCulloch
The Last Interglacial period, which occurred at about 125 ka, represents the last time global sea levels were at or near modern levels, and by inference, the last time ice volumes and global climatic conditions were similar to present day. High resolution sea-level information for this interval has a direct bearing on Last Interglacial ice volumes and hence on the stability of today's major ice sheets, rheological properties of the mantle, the role of vertical tectonic processes since the Late Pleistocene and the unresolved question concerning the validity of the astronomical or Milankovitch model of climate change. The Milankovitch model maintains that fluctuations in Pleistocene climate are driven by periodic changes in summer solar insolation in the northern hemisphere, caused by variations in the eccentricity of Earth's orbit and the tilt and precession of Earth's rotation axis. Recent insolation predictions for latitude 65deg.N show a peak between 128 ka and 126 ka. It is usually assumed that this marks the onset of the Last Interglacial period.
The measurement of uranium and thorium isotopes by thermal ionization mass spectrometry (TIMS) can date fossil corals from within Last Interglacial reefs very precisely. However, despite the growing body of TIMS data in the literature, there remain conflicting estimates of the timing and duration of the Last Interglacial period and the details of sea-level fluctuations within this interval remain unresolved. These discrepancies may, in part, reflect difficulties in assessing the reliability of a 230Th-age, as none of the existing mineralogic, textural and isotopic criteria for evaluating possible open-system behaviour of the U-Th isotopes are self-consistent. Constraints on the initial 234U/238U ratio, often reformulated as d234U(T), are the only direct quantitative indicator of diagenesis of the coral skeleton. However, the effectiveness of placing tight limits on acceptable d234U(T) values is greatly reduced if the quality of the data is poor and only for very high precision measurements can very stringent constraints be applied to the 230Th-age.
We have obtained more than seventy TIMS U-series ages for fossil reefs along the coast of Western Australia, which today are located up to 3 m above mean sea level (Figure 1). These new observations are more reliable than previously published results for several reasons. Firstly, we have selected corals in growth position from localities that are characterised by apparently low levels of diagenesis and relative tectonic quiescence so that the relationship between the reef and coral heights and relative sea level is well constrained. Secondly, using charge collection thermal ionisation mass spectrometry, we have achieved superior precision in thorium isotope measurement; thorium isotope ratios are routinely measured up to a factor of ten more precisely than reported by other laboratories. Thirdly, the level of precision in U isotope measurement is typically 1-2[[perthousand]], significantly better than reported by many earlier TIMS workers. The combined improvements in the measurement of both U and Th isotopes has led to up to a factor of four reduction in the age uncertainty due to analytical errors, excluding the uncertainty in the decay constants, potentially allowing the finer details of sea-level change during the Last Interglacial interval to be resolved. In addition, d234U(T) values, determined from both 230Th/238U and 234U/238U, have uncertainties which are significantly smaller than previously reported. When combined with a strict d234U(T) criteria, as discussed above, this allows samples which have undergone diagenetic exchange of uranium and thorium to be more easily identified and discarded; the remaining "acceptable" corals should give the most reliable as well as the most precise chronology for the Last Interglacial period.

Figure 1: Raised coral platform of Last Interglacial age at Burney Point on the Western Australian coast, south of Geraldton
Strict criteria were adopted to screen the new Western Australian data and indicate that the main episode of reef growth was confined to a very narrow interval, occurring from about 129+/-1 ka to 122+/-1 ka (Figure 2). Approximately 90% of "reliable" data cluster between these two age limits and no ages older than 129 ka were documented. This may indicate that the Last Interglacial was of short duration, extending from approximately 122 ka to 129 ka only, in reasonable agreement with the idea that global climate is driven by orbital cycles.

Figure 2: Uranium isotopic composition 234U/238U at the time of coral growth T versus 230Th-age for reliable samples from Western Australia, analysed at ANU. We determined a d234U value of 148.9 +/- 0.8[[perthousand]] for modern coral, indicated by the black horizontal line. Samples with d234U(T) values within 4 perthousand of the modern value (shown by the shaded band) are considered to have 230Th-ages which are accurate to within +/-1000 years. Only these data are considered "reliable" and are plotted.
Constraints on the former Antarctic ice sheet from sea-level observations and geodynamic modelling
D. Zwartz, K. Lambeck, M. Bird and J. Stone
An approach to estimating former ice sheet dimensions that is complementary to geomorphological studies is to model the effects of changes in the ice sheets on sea level. In the absence of vertical tectonic movements, sea-level change over thousands of years can be attributed to the combined effect of the movements of ice and water masses on the surface of the earth and the concomitant gravitational and isostatic responses. Semi-quantitative evidence for some rebound of the Antarctic margin exists from a variety of locations but accurate records are few. One such record has been obtained from the Vestfold Hills area where cores from low-lying lakes contain marine sediments, indicating that the lakes were formerly connected to the sea and have subsequently been isolated as sea level fell relative to the land. Radiocarbon dating of transitions between marine and lacustrine sedimentation in these cores, combined with accurate levelling of the lakes' last connection to the sea, indicates that relative sea level in that region rose from about 7.5 m at 8000 years ago to a height of 9 m above present sea level around 6000 years ago, and has fallen steadily since.
Sea level at other sites on the East Antarctic margin also appears to have fallen throughout the last 6000 years, without any evidence of oscillations during this time. Apart from the Vestfold Hills record, no evidence is seen for a local sea-level maximum, a period of sea-level rise preceding the mid-late Holocene fall. This does not necessarily mean that such a maximum did not occur, but reflects the greater accuracy and completeness of the new lake-isolation record compared with the dating of raised shoreline features, which is the most common source of information on former Antarctic sea levels.
To study the influence of ice-sheet changes on sea level at East Antarctic sites, a range of plausible simplified models of the ice sheet margin has been constructed. These models do not attempt to simulate the behaviour of the entire Antarctic ice sheet, but only a region on the margin, on the order of 1000 km. Using realistic models of the earth's response to changing surface loads, the regional ice models described above were used to predict sea-level histories at coastal sites. A large range of scenarios has been investigated, allowing for variation in the maximum extent of the ice and its melting history, and the rheological parameters of the Earth. The optimum ice sheet histories indicate that at the Last Glacial Maximum the East Antarctic ice sheet margin advanced out to different distances beyond its present position for the various locations, with distances ranging from 25 to 110 km. The ice thicknesses at sites now ice free and on the coast ranged from 500 to 1000 m at that time. If these values are representative of the entire eastern Antarctic margin and no ice volume changes occur within the interior of the ice sheets, then the total East Antarctic contribution to eustatic sea level since the Last Glacial Maximum is about 3 - 5.5 m.
Late Pleistocene and Holocene sea-level change
K. Lambeck, P. Johnston, C. Smither, K. Fleming and Y. Yokoyama
Sea-level change since the time of the Last Glacial Maximum is dominated by the increase in ocean volume due to the melting of the last Late Pleistocene ice sheets. The actual change observed around the world exhibits considerable spatial variability because of the response of the crust and mantle to the unloading of the glaciated regions and the loading of the sea floor by the new melt-water. Observations of this variability provide important constraints on the mantle rheology, on the history of the ice sheets and on the ice-ocean balance, on the evolution of shorelines and coastal environments, and on estimates of vertical tectonic rates. The group's research is directed at all of these aspects with particular emphasis this year having been placed on a reconstruction of the eustatic sea-level function for the past 20,000 years and on palaeogeographic reconstructions of some of the shallow sea-floor areas that are of interest to pre-historians. Areas for the latter studies have included the Aegean Sea in the eastern Mediterranean, the Persian Gulf, the Irish and Celtic Seas, the North Sea and the French Atlantic margin, and the shallow water regions around Australia. The Persian Gulf results are of interest for understanding the evolution of the Gulf morphology and sedimentary record, including the evolution of the Euphrates Delta. The results also provide a framework for discussing human movements and settlement in Late Palaeolithic and Neolithic times. The Mediterranean results are relevant for estimating the rates of vertical movements from geological indicators that express displacements relative to sea level which, in this case, is itself variable. And, as for the Persian Gulf, the geographic reconstructions also provide new insights into the interpretation of the environmental and human record from Palaeolithic times onwards. Results from the Irish Sea and North Sea are relevant for estimating whether spatial variation in mantle rheology is important across northwestern Europe and for constraining ice volumes at the time of the Last Glacial Maximum. The Australian records are of interest for offshore sedimentological and palaeoenvironmental studies. Results from two of the regional studies are summarised briefly below.
The Persian Gulf. Results for the Persian Gulf are illustrated in Figure 3. From the peak of the glaciation until about 14,000 years BP the Gulf was free from marine influence out to the edge of the Biaban Shelf but the potential existed for extensive shallow lakes and swamps on the Gulf floor along the ancient bed of the Euphrates-Tigris river system throughout Late Glacial time. By about 12,500 years ago the marine incursion into the Central Basin had started and the western Basin flooded about 1000 years later. Much of the southern and northern sides of the Gulf remained dry until about 9000 years BP. The present shorelines was reached shortly before 6000 years ago and exceeded as relative sea-level rose 1-2 m above its present level primarily in response to the hydro-isostatic adjustment of the Earth, inundating the very low areas of lower Mesopotamia.
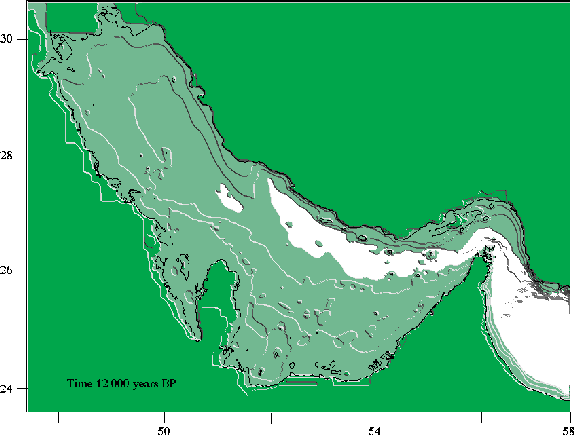
Figure 3: Reconstruction of the palaeoshorelines and palaeobathymetry for the Persian Gulf at 12,000 years ago. The lower part of the Gulf is first flooded at about 13,000 years BP but large freshwater lakes could have developed in several locations within the valley floor. Large shallow depressions also occur on the southern margin of the present Gulf.
The region at the northern end of the present Gulf and at the junction of the Euphrates and Tigris Rivers was settled by the early Sumerians during the fourth millennium BC but the origin of this civilisation has raised many questions. Whatever directions the search for answers may take, a significant element in the puzzle must be the evolution of the physical environment of the Gulf itself. For example, during Palaeolithic (before about 8000 years BC) and Mesolithic and Neolithic (from 8000 to about 5000 years BC) times much of the Gulf floor would have been exposed (Figure 3) and the broad river valley with lakes and marshes in the flatter regions, would have formed a natural route for people moving westwards from east of Iran. Is this the route travelled by the ancestors of the Sumerians? Another example is that excavations at Ur and elsewhere have led to evidence of a flooding event at about 4000-3000 BC and it is tempting to associate the Sumerian `Flood' legend with the peak of the Holocene transgression during the flooding of the low-lying delta region when sea levels rose perhaps a few meters above present between about 6000 and 3000 years BP.
The Irish Sea. Unlike the Persian Gulf which lies far from the former ice margins, the Irish Sea is a shallow sea-floor region that lies close to the former ice sheet that occurred over the British Isles until about 13,000 years ago and the observed sea-level change here is primarily the result of two contributions: the glacio-isostatic adjustment of the crust to the removal of the ice over the British Isles and the total eustatic sea-level change from the combined global ice sheets. The observational evidence from Ireland and the shores of the Irish Sea is limited but adequate to estimate the ice thickness over the region at the time of the Last Glacial Maximum, about 600 m. The glacio-hydro-isostatic model predicts well the spatial variability in sea-level change observed across the region for Holocene and the latest Late Glacial time, with levels above present being predicted only for northeastern Ireland and north of about Morecambe Bay on the eastern side of the Irish Sea. The models do not support some suggestions that the Late Glacial levels along the east coast of Ireland (eg. at Mell) or the coast of Wales (eg. at Banc-y-Warren) were 50-150 m above their present levels and alternate explanations for these deposits are required. Palaeobathymetry and palaeoshoreline recon-structions for the Irish Sea indicates that a landbridge between Britain and Ireland is likely to have developed only across the Celtic Sea (Figure 4). Because the maximum ice limits over Britain persisted for a relatively short duration only, the maximum rebound occurs a few thousand years after the maximum ice limit was reached and a landbridge develops only in Late Glacial time; from about 18,000 to 14,000 years BP across the Celtic Sea from Cornwall to southern Ireland. No land connection is predicted further north, although the Isle of Man is connected to northwest England briefly from about 14,000 to 11,000 years BP. No connection is predicted between northern Ireland and Scotland either, as has sometimes been suggested. The height of the Celtic Sea sill formed by the emerged sea floor is only a few meters, reaching 5 m at 18,000 years BP and only 1 m at 14,000 years BP. Thus the actual land connection may be quite tenuous because, until such a time as the ice barrier between northern Ireland and Scotland is broken, it will dam the meltwater up to the height of the sill. The tidal amplitude in the Celtic Sea may also have been a few meters so that the exposed sea floor is likely to have provided a hostile environment for any flora or fauna attempting a crossing. This is generally consistent with the fossil record of rather limited faunal contact between Ireland and Britain in Late Pleistocene and Holocene time.
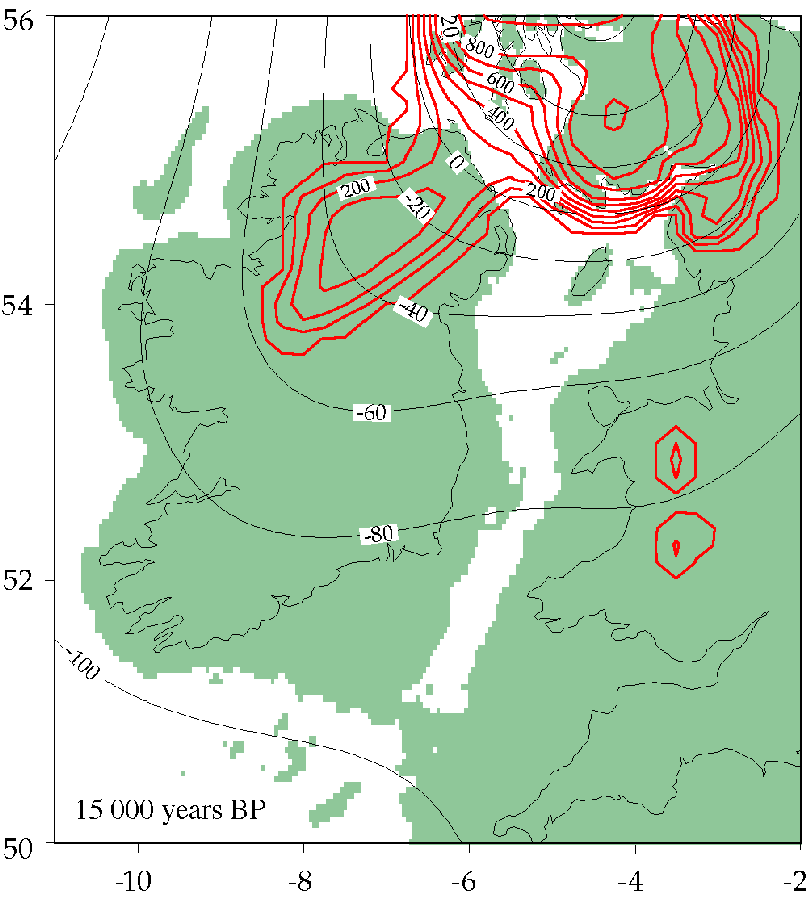
Figure 4: Reconstruction of the palaeoshorelines, ice sheet for Ireland and the Irish Sea at about 15,000 years ago. A narrow land bridge is likely to have developed from about 18,000 to 14,000 years BP across the southern Irish Sea. The contours give the predicted sea-level change between this epoch and the present.
Geophysical consequences of Late Pleistocene deglaciation
P. Johnston
Early this year, new computer programs were developed to calculate sea-level change in response to the Late Pleistocene deglaciation. The new programs are more rigorous in the calculation of the Earth's response to the meltwater load which is now distributed over the oceans according to the changing geopotential and coastline geometry, rather than uniformly over the oceans, or by ad hoc approximations. The latest results have been checked against earlier results to confirm their validity. The modified code is also far more efficient than earlier versions which allow us to test a greater range of model parameters than before.
The results of the sea-level calculation can be used to determine changes in other geophysical parameters. We can now make predictions of the present horizontal velocity of the surface of the Earth, which in combination with vertical motion predictions can be compared with recent observations made by Very Long Baseline Interferometry (VLBI) networks. A preliminary investigation shows that the observations will be best able to infer the viscosity of the upper mantle, and that values of less than 5 x 10²⁰ Pa s will be required to fit present VLBI observations. Changes in the geopotential are also inferred from the deformation of the Earth caused by Late Pleistocene deglaciation and also current changes in ice mass on the surface of the Earth. The change in geopotential affects the orbits of satellites in a predictable way. Comparison of satellite observations and predictions allows us to put some constraints on deep mantle viscosity and the amount of recent melting of polar ice caps. For melting rates of the ice caps which are consistent with the present rate of global sea-level rise, the rate of change of the geopotential requires an average mantle viscosity of at least 5 x 10²¹ Pa s. This is consistent with the deep mantle viscosity inferred from observations of Holocene sea-level change in the British Isles and Australia.

Figure 5: The horizontal component of the predicted present stress field at the surface due to ongoing glacio- and hydro-isostasy relative to the unglaciated state. Compression (inward pointing arrows) occurs in the formerly glaciated regions, with extension (outward pointing arrows) in the forebulge area.
The stress field in formerly glaciated areas is another by-product of the
calculations (Figure 5). In Canada, the present stress field seems to be
dominated by tectonic factors rather than glacial rebound, whereas there are
observations to indicate that the direction of the stress field has changed
since the end of glaciation. The results of our models have been compared with
an independent finite element calculation of lower resolution (from P. Wu,
University of Calgary) and have been found to agree. The model will be used to
investigate the importance of the size of the ice sheet and Earth rheology when
inferring the pattern of stress.
Imaging deep lithospheric structures
H. McQueen and G. Clitheroe
Processing of teleseismic travel-time data has continued this year to extend the imaging of lithospheric velocity structure in central Australia. The study involves the analysis of systematic variations in arrival times of signals from distant earthquakes used to build up a picture of lithospheric velocities in cross sections of the lithosphere. Sixty six events have been digitized from many of the 25 stations on the 150 km Umuwa line across the Musgrave block on the SA-NT border running through Pukatja, Umuwa and Fregon. Preliminary correlations indicate that significant travel time anomalies (around 1 second) are again observed with consistent delay patterns displayed by arrivals from nearby events in a specific source region.
Numerical inversion procedures applied to this data distribute velocity anomalies among discrete blocks within the crust according to a formula based on the paths of the incoming rays. The algorithm repeatedly redistributes travel-time residuals through the area illuminated by the incident ray paths until a consistent velocity picture emerges. A number of regularisation conditions are also applied to counter spurious velocity features in regions of low ray density, where the velocity is not well constrained. This process directs the iteration towards the smoothest models which satisfy the data to specified accuracy and optionally to bias the solution toward shallow sources to test the depth extent of anomalous regions. The absolute velocity structure is recovered from the velocity anomalies using an assumed background velocity gradient. This information is then combined with empirical velocity-density relations to generate predicted gravity profiles as a test of the model structure.
Efforts to improve understanding of such small scale features continue, both through the use of closer station spacing, as in this Umuwa line experiment, and through a more thorough analysis of gravity and magnetic data combined with the development of mechanical models of the deformation. In combination with seismic reflection data this imaging will act as a major constraint on models of the development of Palaeozoic and Proterozoic orogenies at the northern and southern margins of the Amadeus Basin.
Digital Geophysical Databases
J. Braun, H. McQueen and M. Sambridge
Many areas of geology and geophysics require the ability to assemble, process and display digital data in order to extract useful information out of large and complex datasets. Both interpolation and imaging of large datasets are essential steps in reaching an understanding of the tectonic evolution of the crust and lithosphere and the forces that drive it, and it is important to be able to do this quickly, accurately, and interactively.
The 2DMap software package was developed within the Group to display and process large digital datasets. 2DMap provides a user-friendly interface to a suite of routines for projection, colour contouring and artificial illumination of gridded data combined with the overlay of vector information. Other features include: combination of two different datasets on the same map for direct comparison, rapid computation of cross-sections, several map projections at any scale, interactive latitude-longitude sampling, a 3D perspective option, and interfaces to a range of hardcopy formats. Because it uses the machine independent X-Windows graphics protocol, the software may be run on any workstation in RSES and, through the network, across campus and across Australia. It is also used by others in RSES and the Geology Department, and other institutions across the country (including the AGSO and CSIRO). It has recently been commercialized (through ANUTECH) and licences have been sold in Australia, Europe and North America.
A rapid local interpolation algorithm, nearest neighbour (n-n) interpolation, has been developed in cooperation with the Seismology Group and is proving a valuable tool for handling large raw datasets. The method uses Delaunay triangulation to identify nearest neighbour interpolating points and to create influence cells whose area of overlap forms the basis of the interpolation. Computation time for the triangulation is linear in the number of data points, and the subsequent gridding is linear in the number of grid points, so the method is ideally suited for large datasets with wide variations in data density, characteristics common to much geophysical data. Development of the method in higher dimensions and to produce smoother interpolant at the nodes is continuing. Presentation of aspects of the method at a specialist mathematics meeting this year has produced valuable feedback on more rigorous aspects of the technique.
The imaging and interpolation software has been developed to date largely with application to observational data. However the recent acquisition of a DEC Alpha server to act as a local compute server complementing the University's supercomputers has enhanced our modelling capabilities and will allow us to make greater use of the software in forward modelling exercises of great detail and complexity.
Another application of the imaging and interpolation software this year has been to turn the large collection of geomagnetic observations from the AWAGS experiment into an accessible video form, in collaboration with Dr C. Barton and his group at AGSO and Dr F. Chamalaun of Flinders University. Display of the station data as a time series of colour coded vectors helped to identify unreliable data which were not apparent during thorough hand editing in the initial stages. Once these problems were corrected, n-n interpolation was used to map the irregularly spaced station data onto a fine regular grid suitable for colour contouring. The display of various elements of the full dataset at a variety of time intervals highlight different aspects of the time evolution of the geomagnetic field.
The importance of erosion/sedimentation on the dynamical evolution of orogenic belts
J. Braun
It is now widely accepted that the efficiency of erosion and sedimentation as processes for transporting mass at the Earth's surface has a strong feed-back on the dynamical evolution of compressional plate boundaries. New numerical methods developed at RSES have allowed us to document quantitatively this complex behaviour.
As show in Figure 6, a piece of continental crust accommodates shortening driven by lithospheric mantle subduction by movement along two crustal-scale shear zones (or faults). The shear zone on the "fixed" side of the orogen (or retro-side to use the convention of Willett et al., 1993) accommodates large strains as the core of the orogen is progressively uplifted; conversely, the shear zone on the "moving" (or pro-) side of the orogen accommodates low amplitude bending strains as material from outside the orogen enters the core. Although symmetrical in terms of strain rate (Figure 6a), the two shear zones develop very different integrated strain histories.
This basic behaviour of "bottom-driven" continental collision is stable for only small amounts of convergence. Rapidly, as deformation accumulates, the increase in pressure inside the orogen resulting from crustal thickening leads to bending and, later, shallowing of the shear

Figure 6: Results of a mechanical/erosional model of mantle driven crustal shortening. (a) initial deformation; (b) late stage deformation assuming no erosion; and (c) steady state evolution assuming total erosion.
zones (Figure 6b). Ultimately, the orogen widens as the retro-shear zone becomes less and less efficient at accommodating shortening and the pro-side of the orogen thickens by pure shear or more "diffuse" deformation.
If the case where the rate of convergence across the orogen is balanced by the rate of mass removal by erosion at the surface, little topography develops and the orogen rapidly reaches an equilibrium state in which material is advected through the orogen with relatively little deformation by movement along the retro-shear zone. The width of the orogen remains constant through time at a value approximately equal to twice the thickness of the crustal layer implicated in the collision (Figure 6c).
The distribution of rocks at the surface of the orogen as well as the thermal structure inside the orogen are widely different in the two cases described above implying that the rate of mass removal from the orogen by erosion strongly affects the patterns of geological observables such as the metamorphic grade or the isotopic age of various mineral systems in rocks collected at the surface across the orogen.
Landscape evolution on tectonic time scales
J. Braun and M. Sambridge
Following the realisation that surface processes play an important role in the dynamics of compressional orogens, the problem of large-scale landscape evolution on tectonic time scales has recently received much attention.
In collaboration with Dr Sambridge of the Seismology Group, we have developed a very powerful new computational technique to study the evolution of surface topography following mass transport by local, diffusional processes (such as weathering, slope wash, mass wasting and soil creep) and long-range processes resulting from channelled flow driven by precipitation. Our new method allows for the discretization of surface landscapes on highly irregular meshes. We make use of concepts borrowed from the field of computational geometry (see Seismology section) to compute efficiently the formation of a complex river network on these irregular meshes.
The new method is much more flexible than conventional methods based on a regular (rectangular) discretization of the landscape: complex geometries can be accounted for, increased spatial resolution is allowed in regions of rapid denudation, the effects of horizontal tectonic movements along strike-slip faults may be taken into account, etc...
But possibly, the greatest advantage of our method is to produce more "natural" river networks as river segments between nodes of the numerical mesh are not constrained to follow one of four prescribed directions (N-S, E-W, NE-SW and NW-SE); rather, river segments are allowed to develop in any direction. This is well illustrated in Figure 7, where the results of a model run in which symmetrical escarpments on either side of a trapezoidal plateau are eroded away by a combination of water/bedrock interaction in river channels and diffusion processes. In Figure 7a, our method was used; in Figure 7b, a similar algorithm was used but the landscape was discretized using a regular rectangular grid. The topography and river network that develop on the unstructured mesh are very different from those of the structured mesh. The rivers that formed on the irregular grids have a definitely more "natural" geometry; in fact, the river network is, like most natural networks, space filling and obeys the three laws of natural network composition. The resulting topography has also fractal properties similar to natural landscapes. Furthermore, fewer, larger catchments develop on a regular grid. But, most importantly, the average length of streams flowing from the top of the escarpment to the boundaries of the model is greater in the model run done on the irregular mesh than in the model run done on the regular mesh. Consequently, the rate of mass removal from the system by river-bedrock interaction is greater in the model run based on irregular spatial discretization. This difference of behaviour is certainly very important when the results of such computations are used to constrain the rate of erosional processes on tectonic time scales.
Figure 7: Results of two numerical simulations of surface erosion, (a) on an irregular grid and (b) on a regular grid. The black thick lines are computed streams and the white lines define their catchment area.
Thermal and geochronological implications of modelled tectonic heat transport in continental collision zones - application to the thermal evolution of the Southern Alps of New Zealand
G. Batt and J. Braun
The relative efficiency of surface and near surface processes (eg erosion and mass transport or hydrothermal fluid circulation) as heat transport mechanisms compared to the diffusion of heat through crustal rocks results in the Earth's surface acting as a major thermal boundary layer. It follows from this that the exposure of rocks from depth by uplift and erosion is accompanied by significant cooling. This relationship is well appreciated in modern geoscience, and is often used to infer aspects of the structural and tectonic development of mountain belts from regional thermal histories.
Using a 2-dimensional numerical model of the Earth's upper crust, we have investigated the effects of this style of dynamic thermal perturbation on isotopic ages and other temperature linked data in active continental collisional zones. Our model, based on the results of recently developed dynamical simulations of crustal shortening, predicts a series of complex thermally based effects that should be observed at the surface: (a) two-stage pressure-temperature histories - with initially near-isothermal and subsequent near-isobaric cooling, (b) cooling rates of exposed material increasing exponentially over time, (c) short wavelength spatial variations in isotopic ages, and (d) inverted age trends.
Each of these features is often interpreted as indicating some degree of complexity in aspects of regional dynamics when observed in geological studies of real mountain belts. That such a range of features can be produced by a kinematically simple model suggests that such complex interpretations may not be necessary in many cases.
The Southern Alps of New Zealand are an active, tectonically simple, relatively accessible mountain range, and as such, they represent an excellent example for testing our models of continental collisional dynamics of this sort. Using our finite element numerical modelling methods to solve the transient heat conduction-advection, we have derived dynamic models of the evolution of the geothermal structure of the region. We then used these models to simulate thermally based data of forms that are easily observable at the surface of the orogen - principally isotopic ages for a variety of mineral systems.
Our models are largely constrained by a combination of K-Ar, Ar-Ar, and fission track ages of samples collected along a number of transects across the Southern Alps. These provide constraint both directly, through comparison to isotopic ages simulated in our models, and indirectly through the evaluation of cooling histories for local areas from collating the ages and closure temperatures of a number of mineral separates for an individual sample.